
1. 5 Whys
History: The 5 Whys was developed by Sakichi Toyoda, the founder of Toyota Motor Corporation.
Background: The 5 Whys is a simple but powerful tool for root cause analysis. It involves asking “why?” five times in a row to get to the root cause of a problem.
How to do it:
Start by identifying a problem.
Ask “why?” five times in a row to get to the root cause of the problem.
The root cause is the answer to the fifth “why?” question.
Importance: The 5 Whys is a valuable tool for understanding the root cause of problems. It can help you to identify and address the underlying issues, so that you can prevent the problem from recurring.
2. Affinity Diagram
History: The Affinity Diagram was developed by Jiro Kawakita, a Japanese management consultant.
Background: The Affinity Diagram is a tool for organizing and grouping ideas. It is often used in brainstorming sessions to help identify and prioritize problems or opportunities.
How to do it:
Brainstorm a list of ideas related to the problem or opportunity.
Write each idea on a sticky note or index card.
Group the sticky notes or index cards into natural groupings.
Give each group a name that describes the common theme.
Importance: The Affinity Diagram is a helpful tool for making sense of a large number of ideas. It can help you to identify patterns and relationships, and to prioritize the most important ideas.

3. Brainstorming
History: Brainstorming was developed by Alex F. Osborn, an American advertising executive.
Background: Brainstorming is a group creativity technique that involves generating a large number of ideas in a short period of time.
How to do it:
Gather a group of people who are familiar with the problem or opportunity.
Set a time limit for the brainstorming session.
Encourage everyone to participate and to share their ideas.
Do not criticize or judge any ideas, no matter how wild they may seem.
Write down all of the ideas, no matter how good or bad they may seem.
Importance: Brainstorming is a great way to generate a large number of ideas in a short period of time. It can help you to come up with new and innovative solutions to problems.
4. Cause and Effect Diagram
History: The Cause and Effect Diagram was developed by Kaoru Ishikawa, a Japanese quality control expert.
Background: The Cause and Effect Diagram is a visual tool for identifying the potential causes of a problem. It is also known as a fishbone diagram or Ishikawa diagram.
How to do it:
Draw a fishbone diagram with the problem or opportunity written at the head of the fish.
Identify the major categories of causes.
Brainstorm the potential causes for each category.
Draw lines from the major categories to the potential causes.
Importance: The Cause and Effect Diagram is a helpful tool for understanding the root cause of problems. It can help you to identify and address the underlying issues, so that you can prevent the problem from recurring.

5. Control Chart
History: The Control Chart was developed by Walter A. Shewhart, an American statistician.
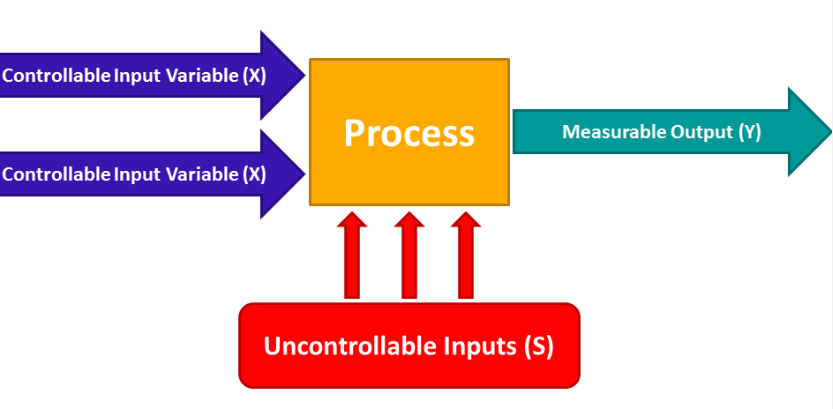
Background: The Control Chart is a statistical tool for monitoring process performance over time. It can help you to identify variations, trends, or instability in a process.
How to do it:
Set up a control chart with the desired specifications.
Collect data on the process over time.
Plot the data on the control chart.
Identify any out-of-control points.
Importance: The Control Chart is a valuable tool for ensuring that a process is operating within its desired specifications. It can help you to identify and address problems early, so that you can prevent defects from occurring.

6. Cost of Poor Quality (COPQ)
History: The Cost of Poor Quality (COPQ) was developed by Armand V. Feigenbaum, an American quality control expert.
Background: The COPQ is a metric for quantifying the financial impact of poor-quality products or services. It can be used to track the improvement of quality over time.
How to do it:
Identify the costs associated with poor quality.
Calculate the total cost of poor quality.
Track the cost of poor quality over time.
7. Design of Experiment (DOE)
History: The Design of Experiment (DOE) was developed by Sir Ronald A. Fisher, an English statistician.
Background: The DOE is a statistical tool for planning, conducting, and analyzing experiments. It can be used to optimize processes or products.
How to do it:
Identify the factors that you want to test.
Create a design matrix.
Collect data on the experiments.
Analyze the data to identify the factors that have the greatest impact on the outcome.
Importance: The DOE is a powerful tool for improving processes and products. It can help you to identify the factors that have the greatest impact on the outcome, so that you can optimize your process or product.

8. Kaizen
History: Kaizen is a Japanese term that means “continuous improvement.”
Background: Kaizen is a philosophy of continuous improvement that involves making small, incremental changes to processes, products, or services.
How to do it:
Identify areas for improvement.
Make small, incremental changes to the process.
Monitor the results of the changes.
Repeat steps 2 and 3 until the desired results are achieved.
Importance: Kaizen is a powerful tool for improving processes and products. It can help you to make small, but meaningful changes that can have a big impact on the overall performance of your organization.
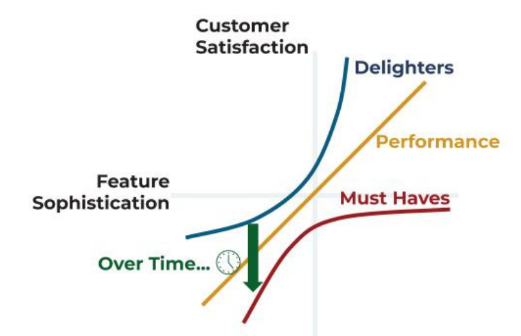
9. Kano Model
History: The Kano Model was developed by Noriaki Kano, a Japanese quality management expert.
Background: The Kano Model is a tool for classifying customer requirements and preferences. It helps you to understand how customers perceive different types of requirements.
How to do it:
Identify the customer requirements.
Classify the customer requirements into the following categories:
Must-be requirements: These are the basic requirements that customers expect.
Expected requirements: These are the requirements that customers want.
Delighters: These are the requirements that exceed customer expectations and delight them.
Importance: The Kano Model is a helpful tool for understanding customer requirements. It can help you to focus on the requirements that are most important to customers, so that you can improve their satisfaction.

10. Lean Six Sigma
History: Lean Six Sigma is a combination of two quality improvement methodologies: Lean and Six Sigma.
Background: Lean focuses on eliminating waste and improving efficiency, while Six Sigma focuses on reducing defects.
How to do it:
Identify the waste and defects in the process.
Develop and implement solutions to eliminate the waste and defects.
Monitor the process to ensure that the improvements are sustained.
Importance: Lean Six Sigma is a powerful tool for improving processes and products. It can help you to eliminate waste, reduce defects, and improve efficiency.

11. Mistake Proofing
History: Mistake Proofing was developed by Shigeo Shingo, a Japanese industrial engineer.
Background: Mistake Proofing is a technique for preventing defects from occurring. It involves designing processes in a way that makes it difficult or impossible to make mistakes.
How to do it:
Identify the potential defects in the process.
Design the process in a way that makes it difficult or impossible to make those defects.
Implement the changes to the process.
Importance: Mistake Proofing is a valuable tool for preventing defects. It can help you to improve the quality of your products or services and reduce the costs associated with defects.

12. PDCA (Plan-Do-Check-Act)
History: The PDCA Cycle was developed by W. Edwards Deming, an American quality control expert.
Background: The PDCA Cycle is a continuous improvement methodology that consists of four steps:
Plan: Define the problem or opportunity and develop a plan to address it.
Do: Implement the plan and collect data on the results.
Check: Analyze the data to determine if the plan is successful.
Act: Take action to improve the plan or implement a new plan.
How to do it:
Define the problem or opportunity.
Develop a plan to address the problem or opportunity.
Implement the plan and collect data on the results.
Analyze the data to determine if the plan is successful.
Take action to improve the plan or implement a new plan.
Importance: The PDCA Cycle is a valuable tool for continuous improvement. It can help you to identify and address problems

13. Pareto Chart
History: The Pareto Chart was developed by Vilfredo Pareto, an Italian economist.
Background: The Pareto Chart is a graphical tool for visualizing the relative importance of different problems or opportunities.
How to do it:
Identify the problems or opportunities.
Collect data on the frequency of each problem or opportunity.
Plot the data on a Pareto Chart.
Identify the few problems or opportunities that are causing the most problems.
Importance: The Pareto Chart is a helpful tool for identifying and prioritizing problems or opportunities. It can help you to focus your efforts on the problems or opportunities that are most important.

14. Process Flowchart
History: The Process Flowchart was developed by Frank Gilbreth, an American industrial engineer.
Background: The Process Flowchart is a graphical tool for documenting the steps in a process or system.
How to do it:
Identify the steps in the process or system.
Draw a flowchart of the steps.
Label the steps in the flowchart.
Importance: The Process Flowchart is a helpful tool for understanding and improving processes. It can help you to identify bottlenecks, inefficiencies, and areas for improvement.

15. House of Quality (or QFD)
History: The House of Quality (or QFD) was developed by Yoji Akao, a Japanese quality control expert.
Background: The House of Quality is a tool for translating customer requirements into design requirements. It is also known as quality function deployment (QFD).
How to do it:
Identify the customer requirements.
Translate the customer requirements into design requirements.
Prioritize the design requirements.
Develop a plan to achieve the design requirements.
Importance: The House of Quality is a valuable tool for ensuring that products or services meet customer requirements. It can help you to focus on the most important customer requirements and to develop a plan to achieve those requirements.
16. Quality Circles
History: Quality Circles were developed by Kaoru Ishikawa, a Japanese quality control expert.
Background: Quality Circles are small groups of employees who meet regularly to discuss and solve quality problems.
How to do it:
Form a Quality Circle.
Select a quality problem to work on.
Gather data on the problem.
Analyze the data and develop solutions.
Implement the solutions and monitor the results.
Importance: Quality Circles are a valuable tool for involving employees in quality improvement. They can help to identify and solve quality problems, and to improve employee morale and motivation.
17. Scatter Plot
History: The Scatter Plot was developed by Karl Pearson, an English statistician.
Background: The Scatter Plot is a graphical tool for visualizing the relationship between two variables.
How to do it:
Select two variables.
Plot the data for the two variables on a scatter plot.
Look for a pattern in the data.
Importance: The Scatter Plot is a helpful tool for identifying relationships between variables. It can help you to understand how changes in one variable affect another variable.
18. Statistical Process Control (SPC)
History: Statistical Process Control (SPC) was developed by Walter A. Shewhart, an American statistician.
Background: SPC is a statistical methodology for monitoring and controlling process variation.
How to do it:
Set up control charts for the process variables.
Collect data on the process variables over time.
Plot the data on the control charts.
Identify any out-of-control points.
Importance: SPC is a valuable tool for ensuring that processes are operating within their desired specifications. It can help you to identify problems early, so that you can prevent defects from occurring.
19. Six Sigma Methodology
History: The Six Sigma Methodology was developed by Bill Smith and Mikel Harry, two American engineers.
Background: Six Sigma is a quality improvement methodology that focuses on reducing defects.
How to do it:
Define the problem or opportunity.
Measure the current level of performance.
Analyze the causes of the defects.
Improve the process to reduce the defects.
Control the process to ensure that the improvements are sustained.
Importance: Six Sigma is a powerful tool for improving processes and products. It can help you to reduce defects
20. Taguchi Methods
History: Taguchi Methods were developed by Genichi Taguchi, a Japanese engineer.
Background: Taguchi Methods are a set of statistical tools for designing products and processes that are robust to variation.
How to do it:
Identify the critical quality characteristics.
Design experiments to identify the factors that affect the critical quality characteristics.
Optimize the process to minimize variation in the critical quality characteristics.
Importance: Taguchi Methods are a valuable tool for ensuring that products and processes are robust to variation. They can help you to improve the quality of your products or services and reduce the costs associated with defects.
21. TPM (Total Productive Maintenance)
History: TPM (Total Productive Maintenance) was developed by Seiichi Nakajima, a Japanese engineer.
Background: TPM is a methodology for improving the reliability and productivity of equipment.
How to do it:
Identify the critical equipment.
Develop a maintenance plan for the critical equipment.
Implement the maintenance plan.
Monitor the results of the maintenance plan.
Importance: TPM is a valuable tool for improving the reliability and productivity of equipment. It can help you to reduce downtime, improve quality, and save money.